This month's CoStar Commercial Repeat Sale Indices (CCRSI) provide the market's first look at November 2013 commercial real estate pricing trends. Based on 1,014 repeat sales in November 2013 and more than 125,000 repeat sales since 1996, the CCRSI offers the broadest measure of commercial real estate repeat sales activity.
November 2013 CCRSI National Results Highlights
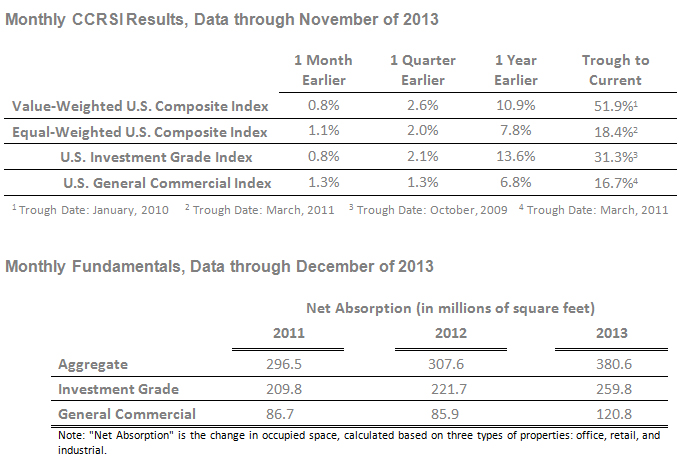
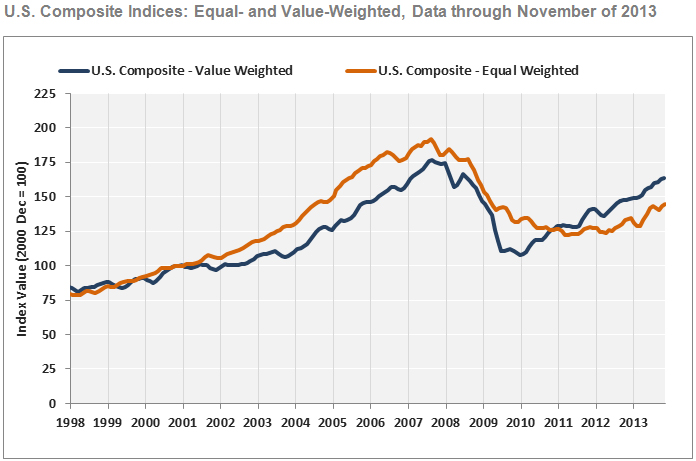
- COMMERCIAL PROPERTY PRICES CONTINUED THEIR STEADY UPWARD TRAJECTORY IN NOVEMBER: With the U.S. economy on more solid footing during the fourth quarter of 2013 and demand for commercial real estate space on the rise, pricing continued on a steady upward trajectory in November 2013. The two broadest measures of aggregate pricing for commercial properties within the CCRSI—the value-weighted U.S. Composite Index and the equal-weighted U.S. Composite Index—advanced by 0.8% and 1.1%, respectively in November 2013, and rose by a more robust 10.9% and 7.8%, respectively, over the last year.
- RECENT PRICING PERFORMANCE HAS BEEN STEADIER AT THE HIGH END OF THE MARKET: The U.S. Value-Weighted Composite Index, which weights each repeat-sale by transaction size or value (and therefore is heavily influenced by larger transactions), has increased by a cumulative 51.9% since the start of 2010, reflecting steady demand for institutional-grade property assets in top-tier metro areas that led the recovery. Recent performance in the U.S. Equal-Weighted Composite Index, which weights each repeat-sale equally and is more heavily influenced by smaller transactions, has been more volatile. The Index lost ground in the third quarter of 2013 as it was significantly more impacted by uncertainty concerning the economy and interest rates, but it has since rebounded. The Equal-Weighted Index has increased 18.4% from its trough in 2011.
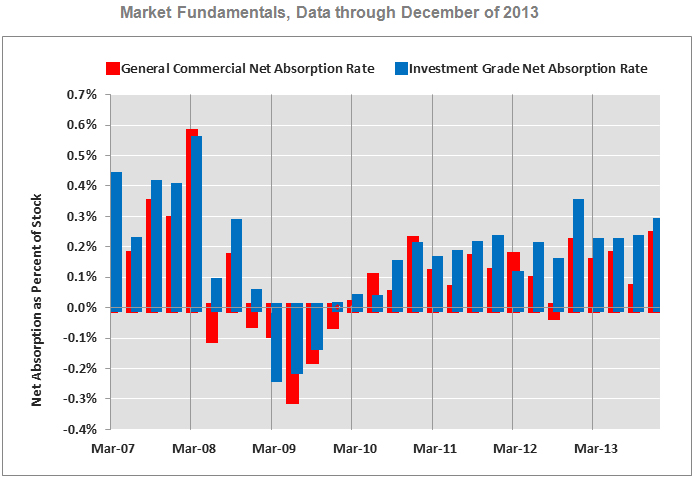
- ABSORPTION EXPANDS AT FASTEST RATE SINCE 2007: Tenants occupied an additional 380 million square feet of office, retail and industrial space throughout the U.S. in 2013, the largest annual gain in net absorption over the past six years. The Investment Grade segment of the market continued to dominate in space absorption. However, the pace of absorption in the General Commercial segment has improved significantly as the recovery is accelerating in the secondary and tertiary markets. The General Commercial segment’s share of total net absorption increased from being less than 30% for the last several years to 32% in 2013.
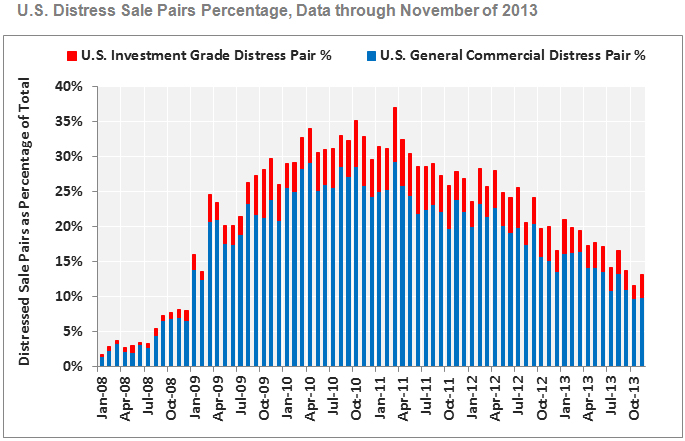
- DISTRESS SALES REMAIN LOW: The percentage of commercial property selling at distressed prices was slightly more than 13% in November 2013, down roughly two-thirds from the peak in 2011. Technology and energy-driven markets including Houston, Denver, Dallas, and Austin have experienced some of the strongest declines in the share of distress property sales activity over the last year, with a reduction of 80% or more.
About the CoStar Commercial Repeat-Sale Indices
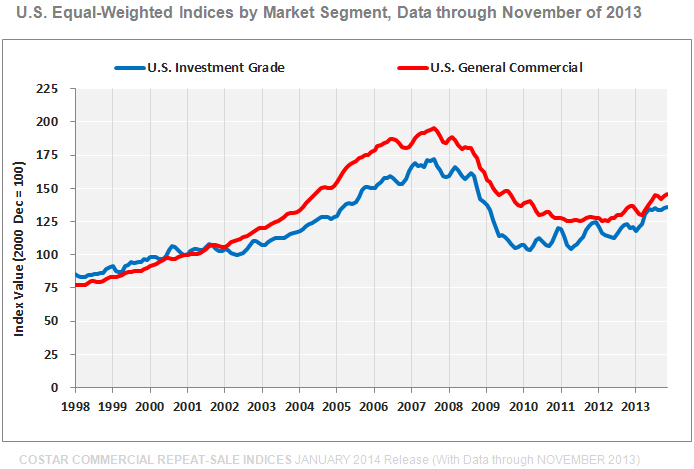
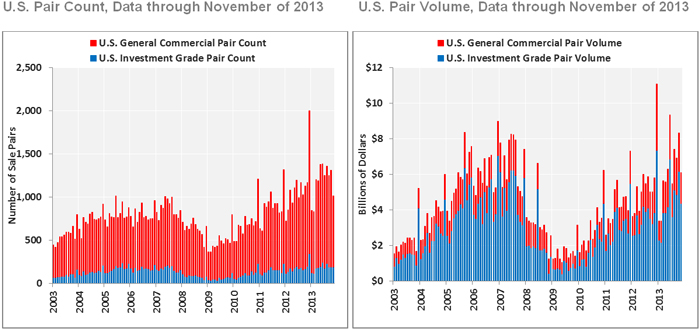
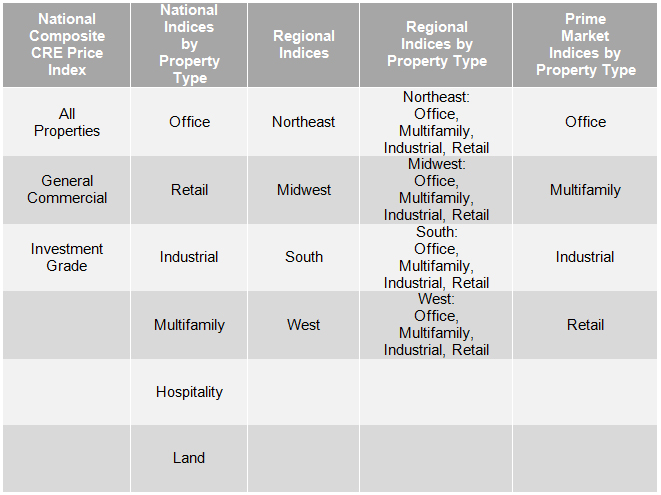
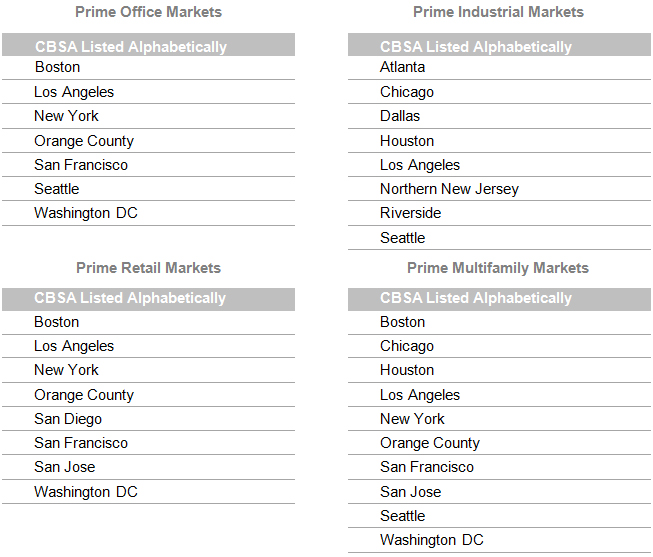
The CoStar Commercial Repeat-Sale Indices (CCRSI) are the most comprehensive and accurate measures of commercial real estate prices in the United States. In addition to the national Composite Index (presented in both equal-weighted and value-weighted versions), national Investment Grade Index and national General Commercial Index, which we report monthly, we report quarterly on 30 sub-indices in the CoStar index family. The sub-indices include breakdowns by property sector (office, industrial, retail, multifamily, hospitality and land), by region of the country (Northeast, South, Midwest, West), by transaction size and quality (general commercial, investment grade), and by market size (composite index of the prime market areas in the country).
The CoStar indices are constructed using a repeat sales methodology, widely considered the most accurate measure of price changes for real estate. This methodology measures the movement in the prices of commercial properties by collecting data on actual transaction prices. When a property is sold more than one time, a sales pair is created. The prices from the first and second sales are then used to calculate price movement for the property. The aggregated price changes from all of the sales pairs are used to create a price index.
Contact:
For more information about the CCRSI Indices, including a detailed methodology, fact sheet, legal notices and disclaimer, and an archive of previous releases, please visit http://www.costar.com/ccrsi.
No comments:
Post a Comment